This unit in Systems and Models, we learned about experiments, quasi-experiments and case studies. We went more in depth about what made a good experiment/case based on the scientific methods. During this course, we read a couple of articles and deciphered which article was the most effective. We didn't get the chance to go on any FE's this unit because we were busy researching for our AP. The purpose of this Action Project is to conduct a research study based on group observation (must include observation of selected group interacting among itself and at least once with another group). Demonstrate scientific method. This AP was time-consuming because it required gathering observations, interviews, gathering research and analyzing data. I worked with a partner, so the work was divided up equally. Overall, I think our research paper came out decent.
Hope you enjoy!
Sunday, March 11, 2018

Tuesday, March 6, 2018
The Cause and Effect of 9/11
This unit in Equality, we learned about the privileges and disadvantages that certain groups can have based on their class, gender, and race. During this course, I learned about intersectionality. Intersectionality is belonging to multiple groups. Being a part of different groups allows each individual to form a unique perspective on issues. There could be a black middle-class male and a black middle-class woman, the fact that they are different gender changes their viewpoints on certain issues. One of my favorite Fe's during this course was going to see Black Panther. The purpose of this AP is to recount an event or moment in history and to tell the story in a marginalized voice. I enjoyed researching and creating this AP because I got to explore a topic that relates to my identity as well as something that I feel is important to discuss.
Below is my project, enjoy!
Below is my project, enjoy!
Thursday, February 15, 2018
A Person With and From Within
During this unit, we learned about psychology and took a variety of personality tests. One test that stood out to me was the Myers-Briggs test because I got results that aligned with how I view myself.This test gave numerous scenarios that you would have to disagree, agree with or choose somewhere in the middle. For this Action Project, we had to create a self-portrait using all the psychology knowledge that we’ve learned over the past few weeks and create an artist statement explaining your piece. Below are my art piece and artist statement. I hope you enjoy!

A Person With and From Within, LD, 2017, Collage
My art piece, A Person With and From Within is a character that portrays LD, this character shows the traits that I have within myself as well as traits I don’t identify with. To create this piece, I used a 14 by 14 piece of fabric that is layered upon more fabric to create the character. Before creating my piece, I sketched out what I wanted my art piece to look like after I gathered a variety of different materials and followed my sketch as to what I wanted the character to look like. In the outside world, I am viewed as extroverted, a natural leader, spontaneous and adaptable. I have taken a few personality tests during the past month; one test whose results surprised me was the DiSC test. The results stated that I am Dominant and Cautious meaning I am decisive, driven, logical and analytical. While some of this might be true, I don’t view myself decisive at all. To highlight my indecisiveness in this piece, I decide to use different materials to create the character to symbolize that I find it hard to stick to one thing. Another test that shocked me was the True Color Test. I found out that I was best described as the orange color because I am good at making decisions, a natural leader and can dominate a situation. What is strange about these results is that I disagree with all of them; I view myself as a follower and have always hated the fact that I couldn’t make my own decisions. To incorporate this into my piece, I decided to I use fabric instead of paint or markers to symbolize that I feel as if I have to display different personalities.
When people view my piece, I want them to understand that we humans possess a variety of personalities but it doesn’t mean we are not being authentic or true to ourselves just because we acknowledge one and ignore the other in situations. There are also test that dictate how you will do in an outside environment such as the TKI test and the Myers-Briggs test. The TKI Conflict Mode Instrument test measures the different degrees of assertiveness and cooperativeness. This test is often used to see how one might solve issues in the job field. My results came in as Competing, meaning that I express above average assertiveness and below average cooperation and that people I work with tend to think that I like to have things my way. I think I am Avoiding because I don’t involve myself in conflicts at all, but when I do I do tend to like to have my things a certain way, I can see both sides of an argument and reflect on my own opinion. I view myself as being the exact opposite of assertive; I am passive and will not involve myself in any conflictions. I found a trend when taking these test that I am a dominant or assertive.I decided to incorporate that trait in my piece because although I might not view myself as this, there might be a part of me that are these traits. The dramatic features such as the lips, nose, eyes, and eyebrows symbolize my dominant personality traits like being assertive.
The Myers-Briggs Type Indicator is a test that measures psychological preferences in how individuals perceive, interact and make decisions. There are 16 different types of personalities that the Myers-Briggs test presents. I got ENTP meaning I am more extroverted and get more energy from being with others, I am more intuitive meaning I act on things instead of observing. I think more about my decision than act on my feelings. I feel like this is the most accurate depiction of how I view myself. To incorporate these results into my piece, I decided to make the pupils tiny to represent that I don’t observe as much as I act.
The Senior class went to the Museum of Contemporary Art to look at the art as well as the artist’s statements. During my time there, I found a few artist’s statements that had lots of detail and a deep understanding of the purpose of their piece. I also saw a few that left me a bit confused; they lacked context or purpose. I took inspiration from an artist named Siobhan Hapaska by giving lots of detail and explanation about my piece in my artist statement.This process was a bit long because I had to make each piece look like a facial feature. Overall, creating the piece was extremely fun for me because I like to make art. I really enjoyed this Action Project, I enjoyed creating my art piece by cutting different fabrics up and gluing it onto the page because I don’t have time to create art as much as I used to. If I were to do this project again, I would incorporate more elements to my art piece. I felt as if I didn’t have enough time to make it exactly how I wanted it to look, but it looks similar to what I had in mind.
Works Cited
“Career Assessments, Myers-Briggs® & More | Career Assessment Site.” A Clear Path for the Future, careerassessmentsite.com/tests/thomas-kilmann-tki-tests/about-the-thomas-kilmann-conflict-mode-instrument-tki/.
“Free DISC Test.” DISC Personality Testing, 15 Jan. 2018, discpersonalitytesting.com/free-disc-test/.
“Free Personality Test.” 16Personalities, www.16personalities.com/free-personality-test.
“Thomas Kilmann Conflict Mode Instrument.” YouTube, YouTube, 18 Sept. 2016, www.youtube.com/watch?v=PFIydyH2H8Y.
Sunday, January 21, 2018
Mapping a Better Tommorow
This unit in Thin Red Lines, my class learned about the importance of maps. Before this class, I had always thought of maps as just being a tool to get around the city. But after taking this class, my idea about maps have broadened. Maps can be used as a tool to get around, more importantly, they tell a story. Maps can tell an interesting story, meaning having one perspective; it's important how you map an area because it can skew your idea about a place. Thin Red Lines has been an exciting class, one FE I really enjoyed was going to Google. We went to Google to talk and ask questions to people who worked with Waze and partnered with Google. I learned that although they'd like to map history and important information regarding each community, it is hard to make a functioning map that helps people get around as well as tell information. For this AP, I had to create 3 separate maps about a specific community by representing and revolving conflicts amongst the people who live there. This AP took lots of researching for data and choosing which data best improved my argument. In the end, I think my final AP came out decent. Below are my maps, enjoy!
Map 1:

The first map of Bronzeville displays what type of assets are in the neighborhood. As a cartographer. I wanted to accurately portray Bronzeville as what it is; to get exact locations I explored Google Maps and searched for locations where there are vacant lots, stores, high schools, etc. Vacant lands are black on the map, hospitals are in navy, TIF in brown, Liquor stores in red, fast food restaurants in yellow, and high schools in white. In Bronzeville, there a lot of vacant spaces, this shows that developers aren’t investing in the area. These mass amounts of vacant lots also make the area look blighted; it makes others and the people who live in that area think negatively about Bronzeville. The Bronzeville TIF only covers a small part of the neighborhood, where the entire area is in desperate need of help. I decided to map the green and red line to show that there are train stations near. Transportation is important for every neighborhood, it allows people to travel around the city for opportunities. I mapped high schools in the area to show there are a few high schools in the area. After looking at each schools’ stats on Niche, I found but they aren’t performing as well as schools in the city. I asked my family members if they could fix something about Bronzeville what it would be, my mom said that she wished there were more grocery stores with better food options like Trader Joes or Whole Foods. She said that she ends up buying a lot of snacks instead of food when she shops at Walgreens or Marianos. I decided to include grocery stores on my map to show that there aren’t enough grocery stores to supply food for the number of people or families living in Bronzeville. As you can see, there is more fast food restaurant than there are grocery stores, where people can buy real and healthy food. To continue to map this idea of food, I mapped fast food restaurants. If there are more fast food restaurants than grocery stores, it is more likely that someone will spend less money for more amounts of food at Mcdonalds. This affects the people living in the neighborhood mentally and physically. In order to keep the body and mind functioning properly, you must eat food that nourishes the body instead of destroying it. To juxtapose that idea of having more fast food restaurants than grocery stores, I mapped hospitals in the area. As shown on the map, there are 4 hospitals in Bronzeville. I don’t think a community would need that many if the people were eating well and taking care of their bodies. If there are more fast food restaurants that led to illnesses, there is going to be a higher demand for hospitals in the area. In addition, I mapped liquor stores to again highlight the proportion of things that can negatively affect the community than there are places that could benefit the people. Based on data from CMAP, people living in the Bronzeville have the highest rate of deadly diseases. This could be from the mass amounts of liquor stores and fast food restaurants or lack of grocery stores. This map notes that across from a high school you can find a fast food restaurant, a liquor store and a hospital: a recipe for disaster.
Map 2:

The second map of Bronzeville displays changes in the area based on community demands. I took the assets that were on the first map and changed the property and added something beneficial to the community. To help the entire community, I expanded the TIF through the whole Bronzeville area. This would help redevelopment of the community by getting rid of those vacant spaces and instead of adding residency or businesses that would improve the area. I brought in more residencies(displayed in maroon) to make the neighborhood have a better sense of community, as well as bring in more families into Bronzeville. According to CMAP, Bronzeville has a plan to develop the area into a mixed-use area that provides commercial and residential spaces. 53% of the current land is residency, while the next highest percentage is 14% being vacant land. Businesses displayed on the map as the color orange is included to bring in more jobs for the community, as well bring in black-owned business to restore the African-American culture Bronzeville is slowly losing. I decided to keep the high schools where they are now, putting another one in the neighborhood would be pointless. Merging the schools could lead to more issues in the neighborhood, so therefore I kept the schools the same as they were before. Taking what my mother said about the area not having enough grocery stores, I decided to add 3 more grocery stores. If it were up to me to decide which grocery stores, I would bring in a Trader Joe's, a Whole Foods Market and a Stanley’s. These stores would allow people around the neighborhood to purchase fresh fruits, vegetables and overall better food options than what’s currently there. I didn’t change the hospitals since it is convenient for people to not have to travel a long way in case of emergencies. One of the biggest differences of this map is the liquor stores, I took away 3 and left 1 for the neighborhood. According to Dr. Marie Crandall from Northwestern’s Feinberg School of Medicine, who found out from a study that neighborhoods with a higher number of liquor stores risk more violence in the area. By taking away most of the liquors stores, I could potentially lower death rates; by keeping one, people still have the option to go the liquor store. Another major change in this map compared to the first are the fast food restaurants. I removed the 5 of the fast food restaurants from the area and kept 2. Since I put more grocery stores in the area that would allow people to go there meaning that there shouldn’t be a high demand for fast food. Although I removed 7 of the fast food chains, there are 2 places to eat fast food in case there are people who cannot afford to go to grocery stores. It’s important that those people eat something even if it’s unhealthy, it's in the vicinity of the high schools displayed on the map. This second map that displays community demands is one that will ensure a healthier and more efficient community.
Map 3:

The last map is a transformational map of Bronzeville. When creating this map I wanted to change Bronzeville in the most beneficial way for the people living there and for the people who travel through. In order to do so, I looked at the first two maps, took what is already there and what the community demands were to create my final transformational map. First, I kept the transportation train lines the same as before. There are already 2 lines in Bronzeville that allow you to travel north and south in the city; buses are also accessible in the area, yet not as efficient as trains are. I decided to add a park underneath the green line station near 45th St where there was once vacant land. This park will bring revenue to the neighborhood while also bringing in more families with children that can play in the park. I decided to keep businesses condensed in the same area to get a mixed-use area with residency near. As stated in the second map, businesses will bring in jobs for people and create a better economy for the area. I didn’t change much involving the high schools, but instead, I changed what is around the schools. Although the high schools’ performance levels are poor, there isn’t anything I can do inside the school to help; I can help by providing better food options to help stimulate their brains. I dispersed the grocery stores around Bronzeville hoping to make them closer to each school. By making food accessible to students I can indirectly help them do better in school. There are still 4 hospitals in the area that are accessible to anyone in the area and in Chicago. As people start to eat less fast food there won’t be as much as a need for many hospitals in one area. One of the big transformations of this last map is the fact that there are no liquor stores in the Bronzeville neighborhood. This will change the community in a positive way. I took away the liquor store because more families are coming in. If there are liquor stores every street, it creates a violent environment to live in. I called my local community organization and asked what the biggest issue is in Bronzeville. One of the organizers said that the violence and shootings that happen almost every week are dangerous for everyone. The most important thing was the fact that there aren’t liquor store near any schools where they can be put in danger. Lastly, there are 3 fast food restaurants dispersed around the area. At first, I wasn’t going to put any on this transformational map, but after thinking about how some people rely on fast food to keep food in their system. This map isn’t interested in one party, but all different types of people that are living in different situations. The goal of this map is to show a transformation of Bronzeville by looking at its current situation and changing it for the better.
Works Cited:
1. “Affordable Rental Housing Developments | City of Chicago | Data Portal.” Chicago Data Portal, data.cityofchicago.org/Community-Economic-Development/Affordable-Rental-Housing-Developments/dkgm-i9fi.
2. “Bronzeville Neighborhood in Chicago, Illinois (IL), 60653 Detailed Profile.” Bronzeville
Neighborhood in Chicago, Illinois (IL), 60653 Subdivision Profile - Real Estate, Apartments, Condos, Homes, Community, Population, Jobs, Income, Streets,
www.citydata.com/neighborhood/Bronzeville-Chicago-IL.html.
3. Chicago Health Atlas, www.chicagohealthatlas.org/indicators/life-expectancy
Demography, www.encyclopedia.chicagohistory.org/pages/962.html.
4. “History and Demographics.” Bronzeville, bronzevilleviolence.weebly.com/history-and-demographics.html.
5. “Public Health Statistics- Selected Underlying Causes of Death in Chicago, 2006 – 2010 | City of Chicago | Data Portal.” Chicago Data Portal, data.cityofchicago.org/Health-Human-Services/Public-Health-Statistics-Selected-underlying-cause/j6cj-r444.
6. Senior, and Niche User. “Explore Phillips Academy High School.” Niche, 26 May 2017, www.niche.com/k12/phillips-academy-high-school-chicago-il/.
7. “Study Links Liquor Stores and Bars to Shooting Risk.” Tribunedigital-Chicagotribune, 19 Sept. 2013, articles.chicagotribune.com/2013-09-19/news/chi-study-links-liquor-stores-and-bars-to-shooting-risk-20130918_1_liquor-store-gun-violence-crandall.
Map 1:
The first map of Bronzeville displays what type of assets are in the neighborhood. As a cartographer. I wanted to accurately portray Bronzeville as what it is; to get exact locations I explored Google Maps and searched for locations where there are vacant lots, stores, high schools, etc. Vacant lands are black on the map, hospitals are in navy, TIF in brown, Liquor stores in red, fast food restaurants in yellow, and high schools in white. In Bronzeville, there a lot of vacant spaces, this shows that developers aren’t investing in the area. These mass amounts of vacant lots also make the area look blighted; it makes others and the people who live in that area think negatively about Bronzeville. The Bronzeville TIF only covers a small part of the neighborhood, where the entire area is in desperate need of help. I decided to map the green and red line to show that there are train stations near. Transportation is important for every neighborhood, it allows people to travel around the city for opportunities. I mapped high schools in the area to show there are a few high schools in the area. After looking at each schools’ stats on Niche, I found but they aren’t performing as well as schools in the city. I asked my family members if they could fix something about Bronzeville what it would be, my mom said that she wished there were more grocery stores with better food options like Trader Joes or Whole Foods. She said that she ends up buying a lot of snacks instead of food when she shops at Walgreens or Marianos. I decided to include grocery stores on my map to show that there aren’t enough grocery stores to supply food for the number of people or families living in Bronzeville. As you can see, there is more fast food restaurant than there are grocery stores, where people can buy real and healthy food. To continue to map this idea of food, I mapped fast food restaurants. If there are more fast food restaurants than grocery stores, it is more likely that someone will spend less money for more amounts of food at Mcdonalds. This affects the people living in the neighborhood mentally and physically. In order to keep the body and mind functioning properly, you must eat food that nourishes the body instead of destroying it. To juxtapose that idea of having more fast food restaurants than grocery stores, I mapped hospitals in the area. As shown on the map, there are 4 hospitals in Bronzeville. I don’t think a community would need that many if the people were eating well and taking care of their bodies. If there are more fast food restaurants that led to illnesses, there is going to be a higher demand for hospitals in the area. In addition, I mapped liquor stores to again highlight the proportion of things that can negatively affect the community than there are places that could benefit the people. Based on data from CMAP, people living in the Bronzeville have the highest rate of deadly diseases. This could be from the mass amounts of liquor stores and fast food restaurants or lack of grocery stores. This map notes that across from a high school you can find a fast food restaurant, a liquor store and a hospital: a recipe for disaster.
Map 2:
The second map of Bronzeville displays changes in the area based on community demands. I took the assets that were on the first map and changed the property and added something beneficial to the community. To help the entire community, I expanded the TIF through the whole Bronzeville area. This would help redevelopment of the community by getting rid of those vacant spaces and instead of adding residency or businesses that would improve the area. I brought in more residencies(displayed in maroon) to make the neighborhood have a better sense of community, as well as bring in more families into Bronzeville. According to CMAP, Bronzeville has a plan to develop the area into a mixed-use area that provides commercial and residential spaces. 53% of the current land is residency, while the next highest percentage is 14% being vacant land. Businesses displayed on the map as the color orange is included to bring in more jobs for the community, as well bring in black-owned business to restore the African-American culture Bronzeville is slowly losing. I decided to keep the high schools where they are now, putting another one in the neighborhood would be pointless. Merging the schools could lead to more issues in the neighborhood, so therefore I kept the schools the same as they were before. Taking what my mother said about the area not having enough grocery stores, I decided to add 3 more grocery stores. If it were up to me to decide which grocery stores, I would bring in a Trader Joe's, a Whole Foods Market and a Stanley’s. These stores would allow people around the neighborhood to purchase fresh fruits, vegetables and overall better food options than what’s currently there. I didn’t change the hospitals since it is convenient for people to not have to travel a long way in case of emergencies. One of the biggest differences of this map is the liquor stores, I took away 3 and left 1 for the neighborhood. According to Dr. Marie Crandall from Northwestern’s Feinberg School of Medicine, who found out from a study that neighborhoods with a higher number of liquor stores risk more violence in the area. By taking away most of the liquors stores, I could potentially lower death rates; by keeping one, people still have the option to go the liquor store. Another major change in this map compared to the first are the fast food restaurants. I removed the 5 of the fast food restaurants from the area and kept 2. Since I put more grocery stores in the area that would allow people to go there meaning that there shouldn’t be a high demand for fast food. Although I removed 7 of the fast food chains, there are 2 places to eat fast food in case there are people who cannot afford to go to grocery stores. It’s important that those people eat something even if it’s unhealthy, it's in the vicinity of the high schools displayed on the map. This second map that displays community demands is one that will ensure a healthier and more efficient community.
Map 3:
The last map is a transformational map of Bronzeville. When creating this map I wanted to change Bronzeville in the most beneficial way for the people living there and for the people who travel through. In order to do so, I looked at the first two maps, took what is already there and what the community demands were to create my final transformational map. First, I kept the transportation train lines the same as before. There are already 2 lines in Bronzeville that allow you to travel north and south in the city; buses are also accessible in the area, yet not as efficient as trains are. I decided to add a park underneath the green line station near 45th St where there was once vacant land. This park will bring revenue to the neighborhood while also bringing in more families with children that can play in the park. I decided to keep businesses condensed in the same area to get a mixed-use area with residency near. As stated in the second map, businesses will bring in jobs for people and create a better economy for the area. I didn’t change much involving the high schools, but instead, I changed what is around the schools. Although the high schools’ performance levels are poor, there isn’t anything I can do inside the school to help; I can help by providing better food options to help stimulate their brains. I dispersed the grocery stores around Bronzeville hoping to make them closer to each school. By making food accessible to students I can indirectly help them do better in school. There are still 4 hospitals in the area that are accessible to anyone in the area and in Chicago. As people start to eat less fast food there won’t be as much as a need for many hospitals in one area. One of the big transformations of this last map is the fact that there are no liquor stores in the Bronzeville neighborhood. This will change the community in a positive way. I took away the liquor store because more families are coming in. If there are liquor stores every street, it creates a violent environment to live in. I called my local community organization and asked what the biggest issue is in Bronzeville. One of the organizers said that the violence and shootings that happen almost every week are dangerous for everyone. The most important thing was the fact that there aren’t liquor store near any schools where they can be put in danger. Lastly, there are 3 fast food restaurants dispersed around the area. At first, I wasn’t going to put any on this transformational map, but after thinking about how some people rely on fast food to keep food in their system. This map isn’t interested in one party, but all different types of people that are living in different situations. The goal of this map is to show a transformation of Bronzeville by looking at its current situation and changing it for the better.
Works Cited:
1. “Affordable Rental Housing Developments | City of Chicago | Data Portal.” Chicago Data Portal, data.cityofchicago.org/Community-Economic-Development/Affordable-Rental-Housing-Developments/dkgm-i9fi.
2. “Bronzeville Neighborhood in Chicago, Illinois (IL), 60653 Detailed Profile.” Bronzeville
Neighborhood in Chicago, Illinois (IL), 60653 Subdivision Profile - Real Estate, Apartments, Condos, Homes, Community, Population, Jobs, Income, Streets,
www.citydata.com/neighborhood/Bronzeville-Chicago-IL.html.
3. Chicago Health Atlas, www.chicagohealthatlas.org/indicators/life-expectancy
Demography, www.encyclopedia.chicagohistory.org/pages/962.html.
4. “History and Demographics.” Bronzeville, bronzevilleviolence.weebly.com/history-and-demographics.html.
5. “Public Health Statistics- Selected Underlying Causes of Death in Chicago, 2006 – 2010 | City of Chicago | Data Portal.” Chicago Data Portal, data.cityofchicago.org/Health-Human-Services/Public-Health-Statistics-Selected-underlying-cause/j6cj-r444.
6. Senior, and Niche User. “Explore Phillips Academy High School.” Niche, 26 May 2017, www.niche.com/k12/phillips-academy-high-school-chicago-il/.
7. “Study Links Liquor Stores and Bars to Shooting Risk.” Tribunedigital-Chicagotribune, 19 Sept. 2013, articles.chicagotribune.com/2013-09-19/news/chi-study-links-liquor-stores-and-bars-to-shooting-risk-20130918_1_liquor-store-gun-violence-crandall.
Thursday, January 18, 2018
Helping Our School One Prototype At A Time
This unit in Rapid Prototyping, we learned about Riemann Sums, Delta and Cartesians 3D printers and the advancement of 3d printers. A Delta 3D printer is a printer that has a pyramid-like shape with three arms and Cartesian 3D printers are cubes that have 3 dimensions (x,y, and z). My favorite FE during this unit was going to the Museum of Science and Industry, I hadn't been to that museum in a while and it brought back a lot of memories. Not only did the museum make me feel nostalgic, it related to what we were learning about 3D printers, technology, and design in Rapid Prototyping. The purpose of this AP was to prototype something that would help our school. We worked with a partner and created 3 different prototypes: we created a clay version, 3D printed and cardboard prototype. I am very happy with the results of my final AP for this unit. Below is my slideshow, enjoy!
Monday, January 8, 2018
Image Transfer
This unit in Woodshop, I got to learn how to use automatic saw machine and how to drill holes with a drill. It was an interesting class, I was a bit intimated at first with all the equipment, but after a few classes, I became comfortable with using these machines. The purpose of this class was to get comfortable using the machines and to create at least one design of our choice. The first classes were for us to get a hands-on experience with the drill, hammers, saw, and sander. The next few classes we started to create out image transfer. We chose images online for what we wanted to use for the image transfers.I decided to use a picture of sonic because it's funny and I like funny stuff.
To transfer the image onto the wood block, I first searched online for a picture. I chose Sonic because it was a funny meme. I think had to measure the size of the image so that it would fit on the block, this was pretty easy because it just took resizing the image. After that, I sent the picture to Aaron (our teacher) and he printed it out. Once it was printed we flipped the back of the image and put some sort of chemical that would make the image stick to the block. Once the image is on the block, we had to use a wet sponge to slowly remove the white paper from the block. Slowly but surely, the image was clear on the block. The only issue with this part was that I accidentally wiped too hard and some of the images disappeared. After that, we used some oil type chemical so that the picture would show up more clearly. Once we did that, we were done with the project!
To transfer the image onto the wood block, I first searched online for a picture. I chose Sonic because it was a funny meme. I think had to measure the size of the image so that it would fit on the block, this was pretty easy because it just took resizing the image. After that, I sent the picture to Aaron (our teacher) and he printed it out. Once it was printed we flipped the back of the image and put some sort of chemical that would make the image stick to the block. Once the image is on the block, we had to use a wet sponge to slowly remove the white paper from the block. Slowly but surely, the image was clear on the block. The only issue with this part was that I accidentally wiped too hard and some of the images disappeared. After that, we used some oil type chemical so that the picture would show up more clearly. Once we did that, we were done with the project!
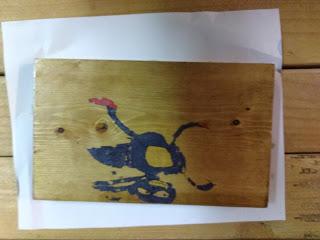 |
| LD, Image Transfer, 2018, Wood |
Wednesday, December 13, 2017
Carve or DIE!
This unit in Rapid Prototyping, our class learned about 2.5D shapes, calculating the distance of a #D shape. The mass is how many atoms are an object. Density is how close the molecules are in an object and the volume of a rectangular prism is l*w*h. For the Field Experience, we went out to Harold Washington Library, to the program YOUMedia. We got a tour around the place and their Maker Lab. The purpose of this Action Project is to create 2 prototypes of a plaque regarding one of the school's core values, APGAA. This project made me think more about designing and how much technology has helped designers create their own ideas. I would like to use a program like Easel and hopefully will carve more in the future!
Subscribe to:
Posts (Atom)